Originally posted on The Conversation
The African Union Charter on Democracy, Elections and Governance clearly expresses the commitment of signatory governments to “human rights and democratic principles,” a representative system of government, and free and fair elections. A new Afrobarometer analysis, released in observance of International Day of Democracy (September 15), suggests that the extent to which African countries put democratic ideals into practice varies widely.
Based on 41,953 face-to-face interviews in 28 countries during Afrobarometer’s ongoing Round 6 (2014-2015) surveys, the analysis shows that on average, barely half of surveyed citizens consider their country a “full democracy” or “a democracy with minor problems.” Moreover, less than half are “fairly” or “very” satisfied with how democracy is working in their country, a decrease from the previous survey round. Other bedrocks of democracy, such as free and fair elections and freedoms of speech, association, and electoral choice, are not yet universal realities, the survey data indicate.
As the African Union and international community work to support African countries to fulfil their commitments to democracy, the perceptions of ordinary citizens provide an important window on progress and remaining challenges. Public opinion surveys by Afrobarometer, a non-partisan research network, reflect nationally representative samples that yield country-level results with a margin of error of +/-2% (for samples of 2,400) or +/3% (for samples of 1,200) at a 95% confidence level. A total of 36 African countries will be surveyed during Round 6, representing 76% of the continent’s population.
Variable supply of democracy
On average across the 28 surveyed countries, a slim majority (52%) of survey respondents perceive their country to be either a full democracy (18%) or a democracy with only minor problems (34%), while a significant minority say they live in “a democracy with major problems” (27%) or “not a democracy” at all (10%).
Countries differ considerably in the extent of democracy that their citizens perceive. Majorities give favourable assessments in 15 countries, led by Mauritius (76%), Botswana (75%), and Namibia (72%) (Figure 1). But at the other extreme, only one-third of citizens in Swaziland and Nigeria share this positive assessment. (Note that Nigerians’ negative assessments of the extent of their democracy, their satisfaction with democracy, and the quality of their most recent national election were captured in December 2014, some three months before the country underwent a historic electoral transition. On the flipside, Burundians’ relatively positive assessments were recorded in September-October 2014, before the violent 2015 election period.) Overall, in 10 of the 28 countries, more citizens say their country is not a democracy or a democracy with major problems than hold the more favourable view.
Figure 1: Extent of democracy | by country | 28 countries | 2014/2015
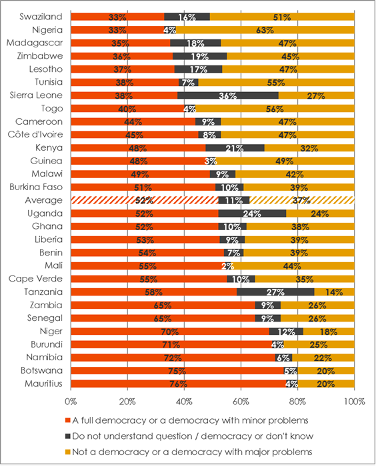
Respondents were asked: In your opinion, how much of a democracy is your country today?
Satisfaction with democracy varies just as widely. Across 28 countries, only a plurality (46%) of citizens say they are “very satisfied” or “fairly satisfied” with the way democracy works in their country (Figure 2), while 43% say they are “not very satisfied” or “not at all satisfied.” Satisfaction runs highest in Namibia (72%) and Botswana (68%) but falls below one-third of citizens in seven countries, including Madagascar (11%), Togo (25%), and Cape Verde (26%).
Figure 2: Satisfaction with democracy | 28 countries | 2014/2015
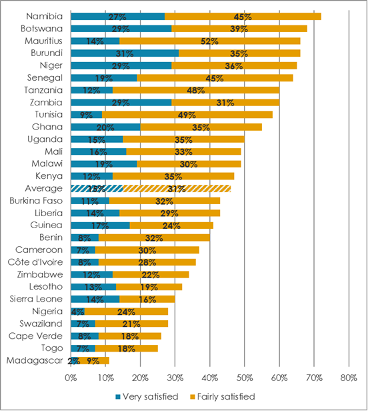
Respondents were asked: Overall, how satisfied are you with the way democracy works in your country?
On average, satisfaction with democracy decreased from 50% in the Round 5 survey (2011-2013) to 46%. Seven countries experienced declines in satisfaction of more than 10 percentage points, most dramatically a 32-percentage–point drop in Sierra Leone (Figure 3). Satisfaction increased markedly, however, in six countries, led by Mali (a 19-percentage-point increase) and Tunisia (18-point increase) (Figure 4).
Figure 3: Declining satisfaction with democracy | 6 countries with declines of more than 10 percentage points | 2011-2015
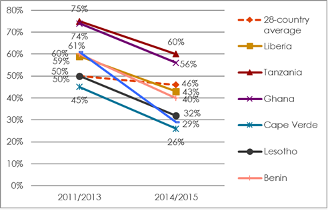
(% “very satisfied” or “fairly satisfied”)
Figure 4: Increasing satisfaction with democracy | 6 countries with largest increases | 2011-2015
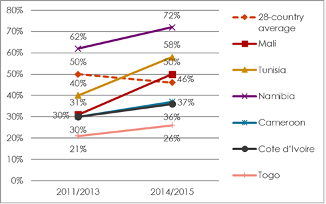
(% “very satisfied” or “fairly satisfied”)
Elections and political freedoms
Across 28 countries, seven in 10 African citizens (70%) say their elections were “completely free and fair” or “free and fair with minor problems” (Figure 5). About nine of 10 citizens in Mauritius (91%) and Senegal (87%) share this view, while citizens in Ghana (46%), Nigeria (46%), Liberia (54%), and Côte d’Ivoire (55%) are least likely to agree.
Figure 5: Quality of elections | 28 countries | 2014/2015
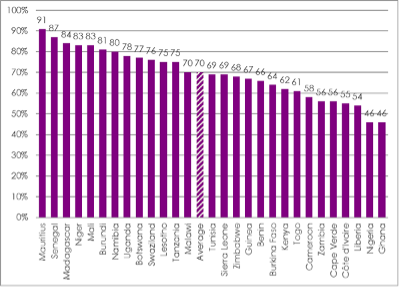
Respondents were asked: On the whole, how would you rate the freeness and fairness of the last national election? (% who say “completely free and fair” or “free and fair with minor problems”)
A bare majority of 51% of citizens say they are “completely free” to speak their minds. Another 26% feel “somewhat free,” while 22% say they are “not at all” or “not very” free to say what they think. Malawi (77%) and Ghana (73%) top the list of those who say they enjoy complete freedom of expression; majorities share this view in 18 of the 28 countries. Freedom of speech is perceived as most limited in in Swaziland (where only 18% say they are completely free), Togo (26%), Zimbabwe (27%), Nigeria (28%), Burkina Faso (31%), and Côte d’Ivoire (31%).
Citizens are somewhat more confident in their freedom of political association. In half of the countries, no more than one in 10 citizens say they are “not very” or “not at all” free. On average across 28 countries, 15% say they lack freedom of association, 21% feel “somewhat free,” and 62% feel “completely free.” The most dramatic exceptions are Swaziland (where 73% of citizens say they do not enjoy freedom of association) and Zimbabwe (41% not free).
Voting freedom is reported to be considerably more robust. Nearly three-fourths (73%) say they are completely free to vote as they choose, while 18% feel at least “somewhat free.” But while 80% or more say they are completely free in 12 countries, in several others confidence is considerably more circumscribed, including Zimbabwe (35% completely free), Nigeria (49%), Côte d’Ivoire (54%), Burundi (55%), and Swaziland (56%). So while overall confidence in voting freedom is high, it is clear that citizens in a number of countries still face significant barriers to voting for the candidate of their choice.
Thomas Bentley is a research assistant for Afrobarometer and a PhD student in the Department of Political Science at Michigan State University. Email: bentle88@msu.edu
Kangwook Han is a research assistant for Afrobarometer and a PhD student in the Department of Political Science at Michigan State University. Email: hakawoo@gmail.com
Peter Halley Penar is a research assistant for Afrobarometer and a PhD student in the Department of Political Science at Michigan State University. Email: ppenar@msu.edu